NASA Astronauts, 1959-Present
Which American Astronaut has spent the most time in space?
1. Prepare Data
- Alma Mater : 모교 (졸업학교인듯)
- Undergraduate Major : 학부 전공
- Graduate Major : 대학원 전공
- Military Rank : 군 계급
- Military Branch : 군 분류
- Space Flights : 우주 비행 횟수
- Space Flight (hr) : 우주 비행 총 시간
- Space Walks : 비행선 밖에서의 임무 수행 횟수 인듯
- Space Walks (hr) : 비행선 밖에서의 임무 수행 시간
import numpy as np
import pandas as pd
import seaborn as sns
import matplotlib.pyplot as plt
import re
from matplotlib.pyplot import pie
%matplotlib inline
df = pd.read_csv("astronauts.csv")
df.head(3)
| Name | Year | Group | Status | Birth Date | Birth Place | Gender | Alma Mater | Undergraduate Major | Graduate Major | Military Rank | Military Branch | Space Flights | Space Flight (hr) | Space Walks | Space Walks (hr) | Missions | Death Date | Death Mission | |
|---|---|---|---|---|---|---|---|---|---|---|---|---|---|---|---|---|---|---|---|
| 0 | Joseph M. Acaba | 2004 | 19 | Active | 5/17/1967 | Inglewood, CA | Male | University of California-Santa Barbara; Univer... | Geology | Geology | NaN | NaN | 2 | 3307 | 2 | 13 | STS-119 (Discovery), ISS-31/32 (Soyuz) | NaN | NaN |
| 1 | Loren W. Acton | NaN | NaN | Retired | 3/7/1936 | Lewiston, MT | Male | Montana State University; University of Colorado | Engineering Physics | Solar Physics | NaN | NaN | 1 | 190 | 0 | 0 | STS 51-F (Challenger) | NaN | NaN |
| 2 | James C. Adamson | 1984 | 10 | Retired | 3/3/1946 | Warsaw, NY | Male | US Military Academy; Princeton University | Engineering | Aerospace Engineering | Colonel | US Army (Retired) | 2 | 334 | 0 | 0 | STS-28 (Columbia), STS-43 (Atlantis) | NaN | NaN |
df.info()
<class 'pandas.core.frame.DataFrame'>
Int64Index: 357 entries, 0 to 356
Data columns (total 19 columns):
Name                   357 non-null object
Year                   330 non-null float64
Group                  330 non-null float64
Status                 357 non-null object
Birth Date             357 non-null object
Birth Place            357 non-null object
Gender                 357 non-null object
Alma Mater             356 non-null object
Undergraduate Major    335 non-null object
Graduate Major         298 non-null object
Military Rank          207 non-null object
Military Branch        211 non-null object
Space Flights          357 non-null int64
Space Flight (hr)      357 non-null int64
Space Walks            357 non-null int64
Space Walks (hr)       357 non-null float64
Missions               334 non-null object
Death Date             52 non-null object
Death Mission          16 non-null object
dtypes: float64(3), int64(3), object(13)
memory usage: 55.8+ KB
2. Changing Data Type
df['Year'] = df['Year'].astype(object)
df['Group'] = df['Group'].fillna(0)
df['Group'] = df['Group'].astype(int)
df['Group'] = df['Group'].astype(object)
df['Birth Date'] = pd.to_datetime(df['Birth Date'], format='%m/%d/%Y')
df[df['Death Date'].notnull()]['Death Date'] # strange Date
10       2/1/2003
14      8/25/2012
24      2/28/1966
36      7/23/2006
42       2/1/2003
46      8/11/2008
51      10/3/2009
58       4/5/1991
63      1/27/1967
67       2/1/2003
70       2/1/2003
78       7/8/1999
79      10/4/2004
98      12/2/1987
102      4/6/1990
116    10/31/1964
129      6/6/1967
139     6/17/1989
140     1/27/1967
154     10/5/1993
170      2/1/2003
171      8/8/1991
173     1/28/1986
192     8/26/2012
205      3/1/2011
209     3/15/2008
219     1/28/1986
222      2/1/2003
226     1/28/1986
246     7/28/2011
250     1/28/1986
252     3/22/1996
255      5/9/2008
264      7/1/2012
271     1/28/1986
274     7/23/2012
275     5/24/2001
278    12/12/1994
281      04/23/01
284      5/2/2007
287     1/28/1986
293     2/28/1966
297     7/21/1998
300     6/13/1993
301     1/28/1986
312    12/27/1982
318     5/24/1986
327     10/3/1995
330      2/6/2012
333     4/23/2001
341     1/27/1967
344     10/5/1967
Name: Death Date, dtype: object
df.ix[281,'Death Date'] = df.ix[281,'Death Date'][:6] + "20" + df.ix[281,'Death Date'][6:]
df['Death Date'] = pd.to_datetime(df['Death Date'], format='%m/%d/%Y')
df.head()
| Name | Year | Group | Status | Birth Date | Birth Place | Gender | Alma Mater | Undergraduate Major | Graduate Major | Military Rank | Military Branch | Space Flights | Space Flight (hr) | Space Walks | Space Walks (hr) | Missions | Death Date | Death Mission | |
|---|---|---|---|---|---|---|---|---|---|---|---|---|---|---|---|---|---|---|---|
| 0 | Joseph M. Acaba | 2004 | 19 | Active | 1967-05-17 | Inglewood, CA | Male | University of California-Santa Barbara; Univer... | Geology | Geology | NaN | NaN | 2 | 3307 | 2 | 13 | STS-119 (Discovery), ISS-31/32 (Soyuz) | NaT | NaN |
| 1 | Loren W. Acton | NaN | 0 | Retired | 1936-03-07 | Lewiston, MT | Male | Montana State University; University of Colorado | Engineering Physics | Solar Physics | NaN | NaN | 1 | 190 | 0 | 0 | STS 51-F (Challenger) | NaT | NaN |
| 2 | James C. Adamson | 1984 | 10 | Retired | 1946-03-03 | Warsaw, NY | Male | US Military Academy; Princeton University | Engineering | Aerospace Engineering | Colonel | US Army (Retired) | 2 | 334 | 0 | 0 | STS-28 (Columbia), STS-43 (Atlantis) | NaT | NaN |
| 3 | Thomas D. Akers | 1987 | 12 | Retired | 1951-05-20 | St. Louis, MO | Male | University of Missouri-Rolla | Applied Mathematics | Applied Mathematics | Colonel | US Air Force (Retired) | 4 | 814 | 4 | 29 | STS-41 (Discovery), STS-49 (Endeavor), STS-61 ... | NaT | NaN |
| 4 | Buzz Aldrin | 1963 | 3 | Retired | 1930-01-20 | Montclair, NJ | Male | US Military Academy; MIT | Mechanical Engineering | Astronautics | Colonel | US Air Force (Retired) | 2 | 289 | 2 | 8 | Gemini 12, Apollo 11 | NaT | NaN |
3. Explore data
- 수치형 데이터 통계값 가지고오기.
- 우주 비행 횟수
- 우주 비행 시간
- 우주 비행선 밖에서의 임무 횟수
- 우주 비행선 밖에서의 임무 수행 시간
df.describe()
| Space Flights | Space Flight (hr) | Space Walks | Space Walks (hr) | |
|---|---|---|---|---|
| count | 357.000000 | 357.000000 | 357.000000 | 357.000000 |
| mean | 2.364146 | 1249.266106 | 1.246499 | 7.707283 |
| std | 1.428700 | 1896.759857 | 2.056989 | 13.367973 |
| min | 0.000000 | 0.000000 | 0.000000 | 0.000000 |
| 25% | 1.000000 | 289.000000 | 0.000000 | 0.000000 |
| 50% | 2.000000 | 590.000000 | 0.000000 | 0.000000 |
| 75% | 3.000000 | 1045.000000 | 2.000000 | 12.000000 |
| max | 7.000000 | 12818.000000 | 10.000000 | 67.000000 |
3.0 남녀 성비
sns.factorplot('Gender',kind='count',data=df) # 남자가 비교되 안되게 많다.
<seaborn.axisgrid.FacetGrid at 0x1ef6fdfd630>

df[df['Gender']=='Female'].groupby(['Undergraduate Major']).size().sort_values(ascending=False)[:5]
Undergraduate Major
Physics                     5
Chemistry                   5
Aeronautical Engineering    3
Electrical Engineering      3
Aerospace Engineering       3
dtype: int64
3.1 우주 비행 횟수 / 시간
- 비행 횟수
- 최대 7, 최소 0
- 평균 2
- 1~3회 정도 분포가 보인다.
df[df['Space Flights']==7] # 가장 많이 우주 비행을 한 비행사.
| Name | Year | Group | Status | Birth Date | Birth Place | Gender | Alma Mater | Undergraduate Major | Graduate Major | Military Rank | Military Branch | Space Flights | Space Flight (hr) | Space Walks | Space Walks (hr) | Missions | Death Date | Death Mission | |
|---|---|---|---|---|---|---|---|---|---|---|---|---|---|---|---|---|---|---|---|
| 65 | Franklin R. Chang-Diaz | 1980 | 9 | Retired | 1950-04-05 | San Jose, Costa Rica | Male | University of Connecticut; MIT | Mechanical Engineering | Applied Plasma Physics | NaN | NaN | 7 | 1602 | 3 | 19 | STS 61-C (Columbia), STS-34 (Atlantis), STS-46... | NaT | NaN |
| 279 | Jerry L. Ross | 1980 | 9 | Retired | 1948-01-20 | Crown Point, IN | Male | Purdue University | Mechanical Engineering | Mechanical Engineering | Colonel | US Air Force (Retired) | 7 | 1393 | 9 | 58 | ST 61-B (Atlantis), ST-27 (Atlantis), ST-37 (A... | NaT | NaN |
plt.figure(figsize=(8,4))
sns.boxplot(df['Space Flights'])
<matplotlib.axes._subplots.AxesSubplot at 0x1ef71736e48>

sns.factorplot('Space Flights',kind='count',data=df, size=6)
<seaborn.axisgrid.FacetGrid at 0x1ef717a7ef0>

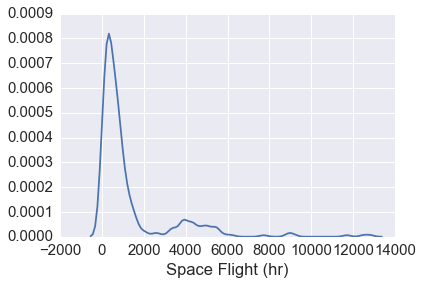
- 비행시간
- 시간이다보니 다양한 시간이 있다.
- 평균 : 590시간
- 최대 : 12818시간
df[df['Space Flight (hr)']==12818]
| Name | Year | Group | Status | Birth Date | Birth Place | Gender | Alma Mater | Undergraduate Major | Graduate Major | Military Rank | Military Branch | Space Flights | Space Flight (hr) | Space Walks | Space Walks (hr) | Missions | Death Date | Death Mission | |
|---|---|---|---|---|---|---|---|---|---|---|---|---|---|---|---|---|---|---|---|
| 346 | Jeffrey N. Williams | 1996 | 16 | Active | 1958-01-18 | Superior, WI | Male | US Military Academy; US Naval Postgraduate Sch... | Applied Science & Engineering | Aeronautical Engineering; National Security & ... | Colonel | US Army (Retired) | 4 | 12818 | 5 | 32 | STS-101 (Atlantis), ISS-13 (Soyuz), ISS-21/22 ... | NaT | NaN |
sns.boxplot(df['Space Flight (hr)']) # 오른쪽 꼬리
<matplotlib.axes._subplots.AxesSubplot at 0x1ef717faa20>

sns.distplot(df['Space Flight (hr)'], hist=False)
C:\Anaconda3\envs\py35\lib\site-packages\statsmodels\nonparametric\kdetools.py:20: VisibleDeprecationWarning: using a non-integer number instead of an integer will result in an error in the future
  y = X[:m/2+1] + np.r_[0,X[m/2+1:],0]*1j


<matplotlib.axes._subplots.AxesSubplot at 0x1ef7183f7b8>
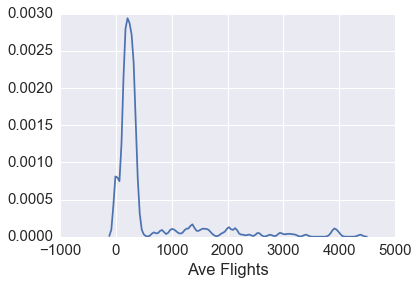
3.1.2 평균 비행 시간
Temp_df = df[["Space Flights","Space Flight (hr)"]]
def getAvg(x):
    if x[0] != 0:
        return x[1]/x[0]
    else:
        return 0
Temp_df['Ave Flights'] = Temp_df.apply(lambda x:getAvg(x), axis=1)
C:\Anaconda3\envs\py35\lib\site-packages\ipykernel\__main__.py:1: SettingWithCopyWarning:
A value is trying to be set on a copy of a slice from a DataFrame.
Try using .loc[row_indexer,col_indexer] = value instead

See the caveats in the documentation: http://pandas.pydata.org/pandas-docs/stable/indexing.html#indexing-view-versus-copy
  if __name__ == '__main__':
sns.distplot(Temp_df['Ave Flights'], hist=False)
C:\Anaconda3\envs\py35\lib\site-packages\statsmodels\nonparametric\kdetools.py:20: VisibleDeprecationWarning: using a non-integer number instead of an integer will result in an error in the future
  y = X[:m/2+1] + np.r_[0,X[m/2+1:],0]*1j


<matplotlib.axes._subplots.AxesSubplot at 0x1ef7130af98>
sns.boxplot(Temp_df['Ave Flights']) # 오른쪽 꼬리
<matplotlib.axes._subplots.AxesSubplot at 0x1ef71a022b0>

order = df.sort_values(by='Space Flight (hr)',ascending=False).head(20).index
sns.barplot(y='Space Flight (hr)',x=df.sort_values(by='Space Flight (hr)',ascending=False).head(20).index ,data=df.sort_values(by='Space Flight (hr)',ascending=False).head(20), order=order)
plt.xticks(rotation=90)
(array([ 0,  1,  2,  3,  4,  5,  6,  7,  8,  9, 10, 11, 12, 13, 14, 15, 16,
        17, 18, 19]), <a list of 20 Text xticklabel objects>)

과연 우주 비행 횟수와 밖에서 임무 수행 한 횟수가 관계가 있을까?
df.columns
Index(['Name', 'Year', 'Group', 'Status', 'Birth Date', 'Birth Place',
       'Gender', 'Alma Mater', 'Undergraduate Major', 'Graduate Major',
       'Military Rank', 'Military Branch', 'Space Flights',
       'Space Flight (hr)', 'Space Walks', 'Space Walks (hr)', 'Missions',
       'Death Date', 'Death Mission'],
      dtype='object')
df[['Space Flights','Space Walks']].corr() # 0.25 그렇게 큰 상관관계가 있지는 않은걸로 판단 된다.
| Space Flights | Space Walks | |
|---|---|---|
| Space Flights | 1.000000 | 0.257073 |
| Space Walks | 0.257073 | 1.000000 |
밖으로 안나간사람의 특징
df[df['Space Walks'] ==0].groupby(['Graduate Major']).size().sort_values(ascending=False)[:5]
Graduate Major
Aeronautical Engineering    15
Medicine                    12
Aerospace Engineering       11
Physics                      9
Mechanical Engineering       6
dtype: int64
df[df['Space Walks'] !=0].groupby(['Space Walks','Graduate Major']).size().sort_index(ascending=False)
Space Walks  Graduate Major
10           Aeronautical Engineering                                                1
9            Mechanical Engineering                                                  1
             Electrical Engineering; Physical Sciences                               1
             Aeronautics & Astronautics; Physical Sciences                           1
8            Physics                                                                 1
7            Systems Engineering; Physical Science (Space Science)                   1
             Ocean Engineering                                                       1
             Medicine                                                                2
             Engineering Management                                                  1
             Electrical Engineering                                                  1
             Biochemistry                                                            1
             Aerospace Engineering; Aeronautical & Astronautical Engineering         1
6            Veterinary Medicine; Public Administration                              1
             Physics                                                                 1
             Ocean Engineering                                                       1
             Mechanical Engineering                                                  2
             Geophysics; Seismology                                                  1
             Chemical Engineering                                                    1
             Biometeorology                                                          1
             Aerospace Engineering                                                   2
5            Mechanical  Engineering; Mechanical  Engineering & Materials Science    1
             Industrial Engineering                                                  1
             Geosciences                                                             1
             Computer Systems; Computer Science                                      1
             Aeronautical Engineering; National Security & Strategic Studies         1
             Aeronautical Engineering                                                1
4            Technology & Policy; Mechanical Engineering                             1
             Operations Research                                                     1
             Mechanical Engineering                                                  1
             Mechanical & Aerospace Engineering                                      1
                                                                                    ..
2            Engineering Science                                                     1
             Electrical Engineering; Business Administration                         1
             Chemical Engineering; Medicine                                          1
             Chemical Engineering                                                    1
             Cancer Biology                                                          1
             Aviation Systems                                                        1
             Astronomy                                                               2
             Astronautics                                                            1
             Aerospace Science; Political Science                                    1
             Aerospace Engineering                                                   3
             Aeronautical Engineering; Aeronautics & Astronautics                    2
             Aeronautical Engineering                                                1
1            Systems Management; Public Health; Medicine; Epidemiology               1
             Nuclear Engineering                                                     1
             Medicine; Aerospace Medicine                                            1
             Medicine                                                                2
             Mechanical Engineering; Aeronautics & Astronautics                      1
             Mechanical Engineering                                                  2
             Engineering Science; Astronomy                                          1
             Engineering Management                                                  1
             Electronics Engineering                                                 1
             Earth Sciences; Geology                                                 1
             Business Administration                                                 1
             Applied Physics                                                         1
             Aerospace Engineering                                                   2
             Aeronautics & Astronautics                                              2
             Aeronautical Systems; Geophysics & Space Physics                        1
             Aeronautical Science                                                    1
             Aeronautical Engineering                                                4
             Aeronautical & Astronautical Engineering                                1
dtype: int64
3.2 언제 가장 많이 비행사를 뽑았을까? ( 시작했을까? )
count_df = pd.DataFrame({'cnt':df['Year'].value_counts()}).reset_index()
count_df.columns = ['Year','Cnt']
count_df['Year'] =  count_df['Year'].astype(np.int)
count_df
| Year | Cnt | |
|---|---|---|
| 0 | 1978 | 35 |
| 1 | 1996 | 35 |
| 2 | 1998 | 25 |
| 3 | 1990 | 23 |
| 4 | 1980 | 19 |
| 5 | 1992 | 19 |
| 6 | 1966 | 19 |
| 7 | 1995 | 19 |
| 8 | 1984 | 18 |
| 9 | 2000 | 17 |
| 10 | 1987 | 15 |
| 11 | 1963 | 14 |
| 12 | 1985 | 13 |
| 13 | 1967 | 11 |
| 14 | 2004 | 11 |
| 15 | 2009 | 9 |
| 16 | 1962 | 8 |
| 17 | 1959 | 7 |
| 18 | 1969 | 7 |
| 19 | 1965 | 6 |
- 1978 / 1996년이 가장 많은 우주비행사를 뽑았다. 왜???
1978 년
1996 년
fig, ax = plt.subplots(figsize=(10,6))
sns.barplot(x='Year', y='Cnt', data=count_df, ax=ax)
<matplotlib.axes._subplots.AxesSubplot at 0x1ef72cfaf98>

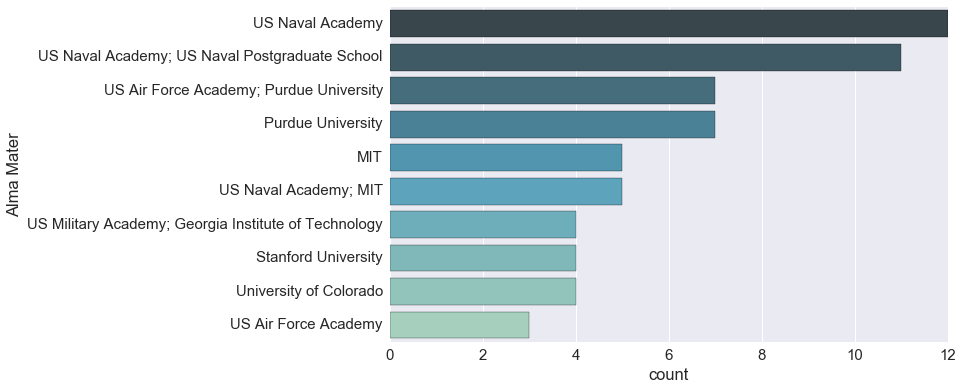
3.3 어느 대학에 나온사람이 많은가?
- 그냥 그림그리기에는 대학의 종류가 너무 많다.
len(df['Alma Mater'].value_counts()) # 280개의 대학교. 최고 10개 대학을 뽑자.
280
university_count = pd.DataFrame({'Cnt':df['Alma Mater'].value_counts()}).reset_index()
university_count = university_count.rename(columns={'index': 'Univ_Name'})
university_count.sort_values(by='Cnt',ascending=True)
university_count.head()
| Univ_Name | Cnt | |
|---|---|---|
| 0 | US Naval Academy | 12 |
| 1 | US Naval Academy; US Naval Postgraduate School | 11 |
| 2 | US Air Force Academy; Purdue University | 7 |
| 3 | Purdue University | 7 |
| 4 | MIT | 5 |
_, ax = plt.subplots(figsize=(10,6))
sns.barplot(data=university_count.head(10), x='Cnt',y='Univ_Name',ax=ax,palette='GnBu_d')
plt.xticks(rotation=90)
(array([  0.,   2.,   4.,   6.,   8.,  10.,  12.]),
 <a list of 7 Text xticklabel objects>)

countCollege = df['Alma Mater'].value_counts()
plt.figure(figsize=(10,6))
sns.countplot(y='Alma Mater', data=df, order=countCollege.nlargest(10).index, palette='GnBu_d')
<matplotlib.axes._subplots.AxesSubplot at 0x1ef72f72b00>
3.4 학부 vs 대학원
df['GoToGraduate'] = df['Graduate Major'].apply(lambda x: 1 if type(x)==str else 0)
df['GoToGraduate'] = df['GoToGraduate'].map({0:"Under",1:'Gradu'})
df['GoToGraduate'].value_counts()
Gradu    298
Under     59
Name: GoToGraduate, dtype: int64
GraduCount = df['GoToGraduate'].value_counts()
plt.figure(figsize=(7,7))
plt.rcParams['font.size'] = 16
patches, texts, autotexts = pie(GraduCount,labels = GraduCount.index, autopct='%1.1f%%' )
texts[0].set_fontsize(20)
texts[1].set_fontsize(20)

3.4.1 대학원 졸업생 중 어느 전공이 많을까?
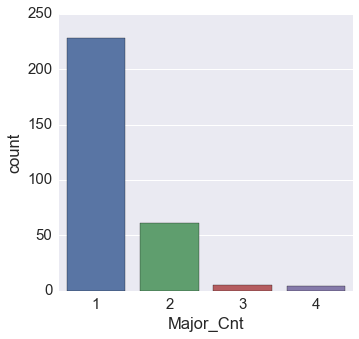
- 2개 이상의 전공을 가진 사람도 꽤 있다.
Gradu_df = df[df['GoToGraduate']=="Gradu"].reset_index()  # 대학원생 졸업.
del Gradu_df['index']
Gradu_df['Major_Cnt'] = Gradu_df['Graduate Major'].apply(lambda x:len(x.split(";")))
Gradu_df['Major_Cnt'].value_counts()
1    228
2     61
3      5
4      4
Name: Major_Cnt, dtype: int64
sns.factorplot('Major_Cnt',kind='count',data=Gradu_df, size=5)
<seaborn.axisgrid.FacetGrid at 0x1ef72eda898>
Major_list = Gradu_df['Graduate Major'].str.split(";")
major_tmp = pd.DataFrame(Major_list.values.tolist()).reset_index()
major_tmp.columns = ['Stu_index','First','Second','Third', 'Fourth']
major_tmp = pd.melt(major_tmp,id_vars=['Stu_index'])
del major_tmp['variable']
major_tmp = major_tmp[major_tmp['value'].notnull()]
major_val_cnt = pd.DataFrame({'cnt':major_tmp['value'].value_counts()})
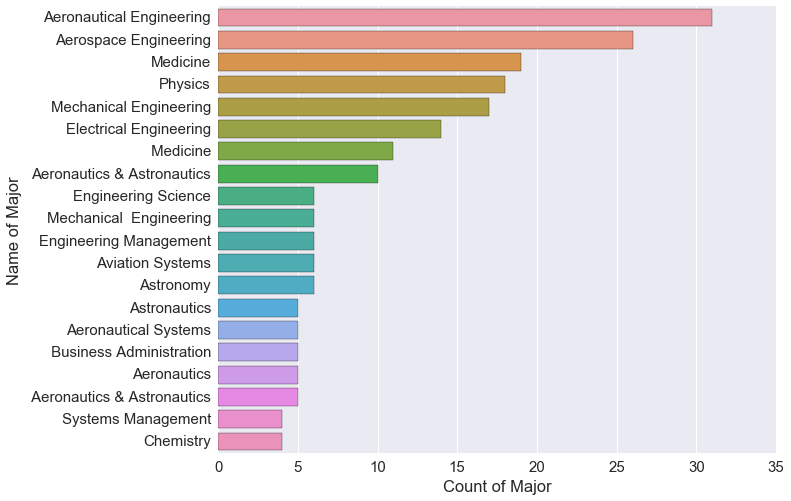
major_val_cnt.head()
| cnt | |
|---|---|
| Aeronautical Engineering | 31 |
| Aerospace Engineering | 26 |
| Medicine | 19 |
| Physics | 18 |
| Mechanical Engineering | 17 |
plt.figure(figsize=(10,8))
sns.set(font_scale=1.5)
sns.barplot(y=major_val_cnt.head(20).index,x='cnt',data=major_val_cnt.head(20))
plt.xlabel("Count of Major")
plt.ylabel("Name of Major")
<matplotlib.text.Text at 0x1ef734258d0>
major_tmp['Engineering'] = major_tmp['value'].apply(lambda x:1 if 'Engineering' in x else 0)
major_tmp['Engineering'] = major_tmp['Engineering'].map({0:'Not Engineering',1:'Engineering'})
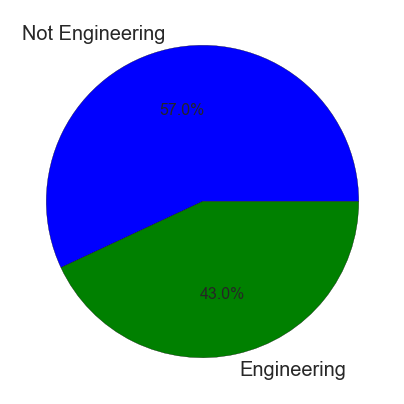
Engineering_Count = major_tmp['Engineering'].value_counts()
Engineering_Count
Not Engineering    217
Engineering        164
Name: Engineering, dtype: int64
plt.figure(figsize=(7,7))
plt.rcParams['font.size'] = 16
patches, texts, autotexts = pie(Engineering_Count,labels = Engineering_Count.index, autopct='%1.1f%%' )
texts[0].set_fontsize(20)
texts[1].set_fontsize(20)
3.5 현재 상태.
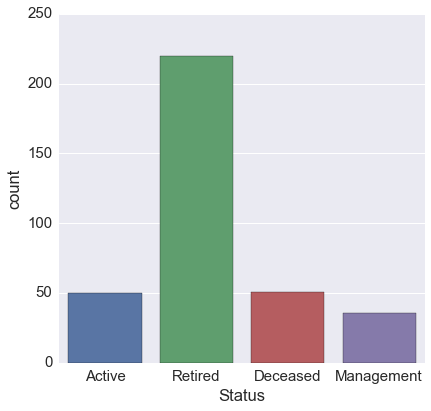
sns.factorplot('Status',kind='count',data=df,size=6)
<seaborn.axisgrid.FacetGrid at 0x1ef734f0b00>
3.6 Group 상태
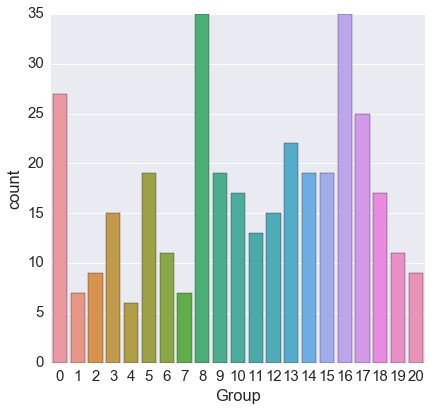
sns.factorplot('Group',kind='count',data=df,size=6)
<seaborn.axisgrid.FacetGrid at 0x1ef73430400>
3.7 군대
3.7.1 군 참여 여부
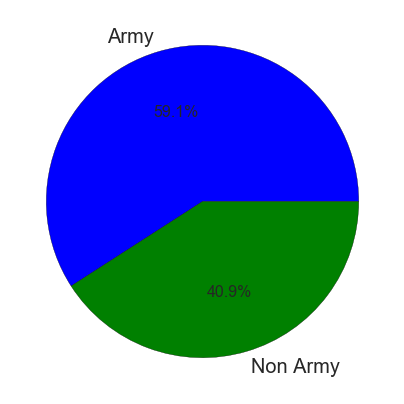
df['Military'] = df['Military Branch'].apply(lambda x: 1 if type(x) == str else 0)
df['Military'] = df['Military'].map({0:'Non Army',1:'Army'})
Mili_count = df['Military'].value_counts()
Mili_count
Army        211
Non Army    146
Name: Military, dtype: int64
plt.figure(figsize=(7,7))
plt.rcParams['font.size'] = 16
patches, texts, autotexts = pie(Mili_count,labels = Mili_count.index, autopct='%1.1f%%' )
texts[0].set_fontsize(20)
texts[1].set_fontsize(20)
3.7.2 군 구분 Count
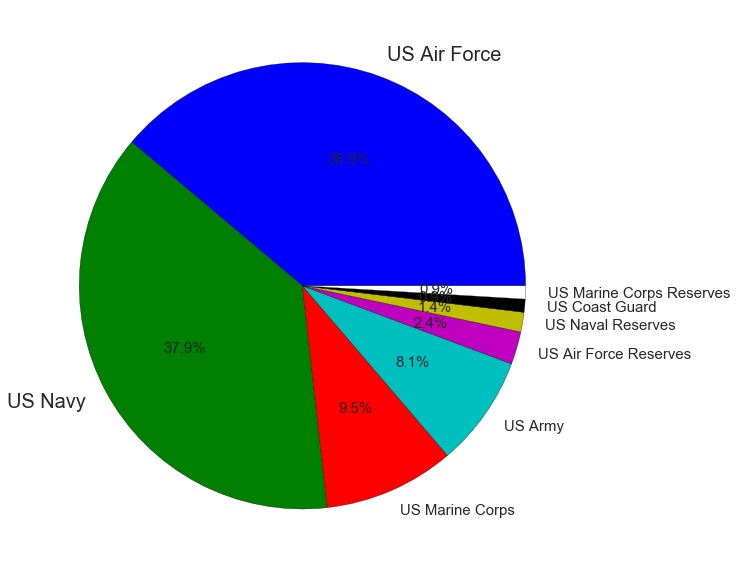
df['Military_Branch'] = df['Military Branch'].str.replace(' \(Retired\)',"").str.strip()
Branch_cnt = df[df['Military_Branch'].notnull()]['Military_Branch'].value_counts()
plt.figure(figsize=(10,10))
plt.rcParams['font.size'] = 15
patches, texts, autotexts = pie(Branch_cnt,labels = Branch_cnt.index, autopct='%1.1f%%' )
texts[0].set_fontsize(20)
texts[1].set_fontsize(20)
3.7.3 군 계급
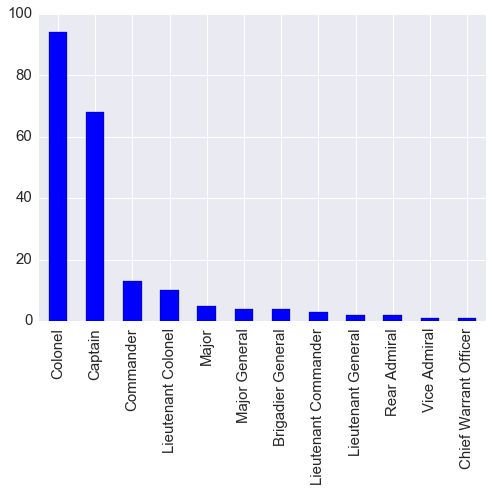
Mili_Rank_Count = df['Military Rank'].value_counts()
plt.figure(figsize=(10,10))
plt.rcParams['font.size'] = 15
patches, texts, autotexts = pie(Mili_Rank_Count,labels = Mili_Rank_Count.index, autopct='%1.1f%%' )
texts[0].set_fontsize(20)
texts[1].set_fontsize(20)
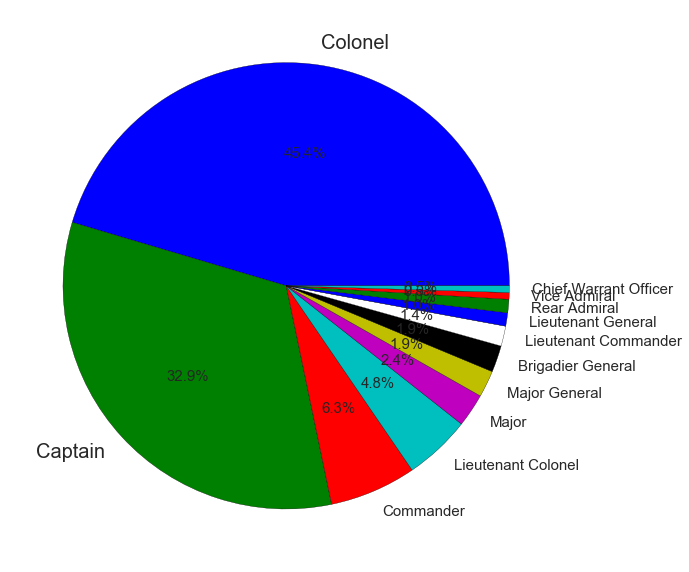
- colonel : 대령(육군)
- captain : 대령(해군 / 해안경비대)
- commander : 중령 ( 해군 / 해안경비대)
- Lieutenant Colonel : 중령 (육군)
- General 류 : 소령
Mili_Rank_Count.plot(kind='bar')
<matplotlib.axes._subplots.AxesSubplot at 0x1ef74904588>
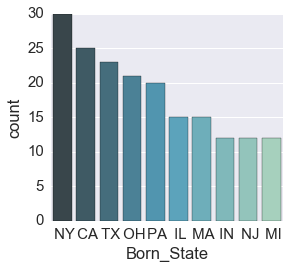
3.8 태어난 지역
df['Birth Place'].head()
0    Inglewood, CA
1     Lewiston, MT
2       Warsaw, NY
3    St. Louis, MO
4    Montclair, NJ
Name: Birth Place, dtype: object
def getPlace(x):
    tmp_string = str.split(x,",")
    if len(tmp_string) > 1:
        return tmp_string[1]
    else:
        return tmp_string[0]
df['Born_State'] = df['Birth Place'].apply(lambda x:getPlace(x))
Born_count = df['Born_State'].value_counts()
sns.factorplot('Born_State',kind='count',data=df, order=Born_count.nlargest(10).index, palette='GnBu_d')
<seaborn.axisgrid.FacetGrid at 0x1ef74d72b38>
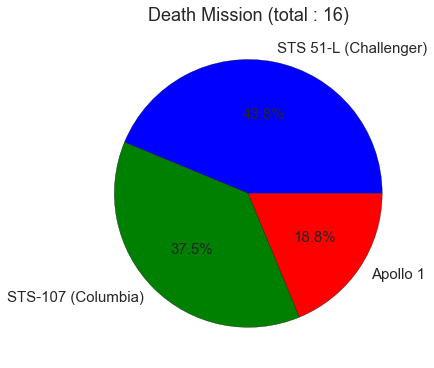
3.9 Death Mission (참사가 일어난 현장)
DeathMission = df[df['Death Mission'].notnull()]['Death Mission'].value_counts()
DeathMission
STS 51-L (Challenger)    7
STS-107 (Columbia)       6
Apollo 1                 3
Name: Death Mission, dtype: int64
plt.figure(figsize=(6,6))
plt.rcParams['font.size'] = 15
patches, texts, autotexts = pie(DeathMission,labels = DeathMission.index, autopct='%1.1f%%' )
texts[0].set_fontsize(15)
texts[1].set_fontsize(15)
plt.title("Death Mission (total : 16)")
<matplotlib.text.Text at 0x1ef74e11240>
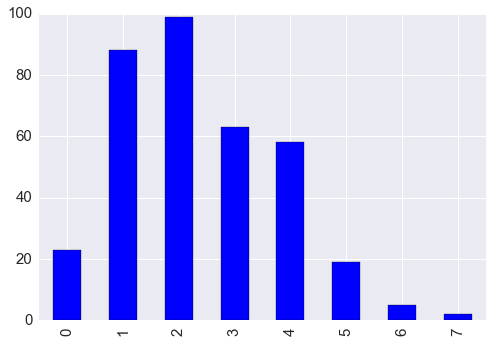
3.10 Missions
- 최대 6번 까지 Mission을 했다.
df['Missions'] = df['Missions'].replace(np.nan, 0)
Mission_list = df[df['Missions'].notnull() & df['Missions']!=0]['Missions'].str.split(',')
df['Missions'].head(5)
0               STS-119 (Discovery), ISS-31/32 (Soyuz)
1                                STS 51-F (Challenger)
2                 STS-28 (Columbia), STS-43 (Atlantis)
3    STS-41 (Discovery), STS-49 (Endeavor), STS-61 ...
4                                 Gemini 12, Apollo 11
Name: Missions, dtype: object
df.iloc[17]['Missions']
0
def getMissionCnt(x):
    if x == 0:
        return 0
    else:
        return len(x.split(','))
df['Mission_cnt'] = df['Missions'].apply(lambda x:getMissionCnt(x))
df['Mission_cnt'].value_counts().sort_index().plot(kind='bar')
<matplotlib.axes._subplots.AxesSubplot at 0x1ef74ec3940>
Mission_df = pd.DataFrame(Mission_list.values.tolist()).reset_index()
Mission_melt_df = pd.melt(Mission_df,id_vars=['index'])
del Mission_melt_df['variable']

Mission_melt_df = Mission_melt_df[Mission_melt_df['value'].notnull()].reset_index()
del Mission_melt_df['level_0']
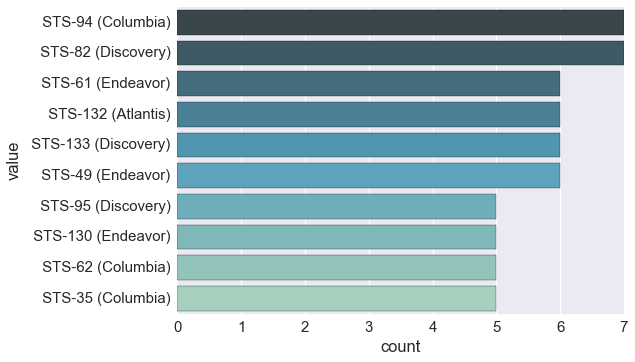
len(Mission_melt_df['value'].unique()) # 382 개 미션.
382
#sns.factorplot('value',kind='count',data=Mission_melt_df,order=Mission_melt_df['value'].value_counts().nlargest(10).index, size=8)
#plt.xticks(rotation=90)
sns.countplot(y='value', data=Mission_melt_df, order=Mission_melt_df['value'].value_counts().nlargest(10).index, palette='GnBu_d')
<matplotlib.axes._subplots.AxesSubplot at 0x1ef74f97e48>
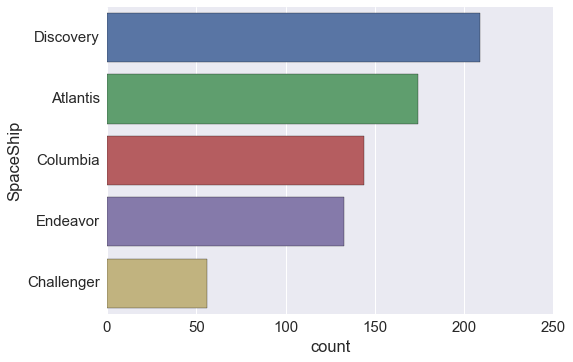
3.10.1 가장 많이 비행했던 우주비행선
def getSpaceShip(x):
    space_shit = re.compile("\(([\w\d\-]+)\)")
    SpaceShip = space_shit.findall(x)
    if len(SpaceShip) > 0:
        return SpaceShip[0]
    else:
        return x
Mission_melt_df['value'].apply(lambda x:getSpaceShip(x))[:5]
0     Discovery
1    Challenger
2      Columbia
3     Discovery
4     Gemini 12
Name: value, dtype: object
Mission_melt_df['SpaceShip'] = Mission_melt_df['value'].apply(lambda x:getSpaceShip(x))
Mission_melt_df['SpaceShip'].unique()
array(['Discovery', 'Challenger', 'Columbia', 'Gemini 12', 'Atlantis',
       'Apollo 8', 'STS-117/120 (Atlantis/Discovery)', 'Endeavor',
       'Gemini 8', 'Soyuz', 'Apollo 12', 'Gemini 7',
       'Apollo-Soyuz Test Project', 'Mercury 7', 'Skylab 4', 'Gemini 9',
       'Apollo 1', 'STS-124/126 (Discovery/Endeavor)', 'Gemini 10',
       'Gemini 5', 'Mercury 9', 'Apollo 7', 'Apollo 16', 'Apollo 17',
       'Skylab 3', 'Mercury 6', 'Gemini 11', 'Mercury 4', 'Apollo 13 ',
       'Apollo 15', 'Skylab 2', 'STS-127/128 (Endeavor/Discovery)',
       'Gemini 4', 'Apollo 14', 'STS-123/124 (Endeavor/Discovery)',
       'Mercury 8', 'Apollo 9', 'Mercury 3', 'Gemini 6',
       'STS-128/129 (Discovery/Atlantis)', 'Apollo 13',
       'STS-116/117 (Discovery/Atlantis)', 'Gemini 3', ' Apollo 11',
       ' Skylab 3', ' Apollo 8', ' Apollo 10', ' Gemini 11', ' Gemini 5',
       ' Apollo 12', ' Gemini 3', ' Gemini 12',
       ' STS-126/119 (Endeavor/Discovery)', ' Apollo 9', ' Gemini 6',
       ' Apollo 14', ' Gemini 9', ' STS-120/122 (Discovery/Atlantis)',
       ' STS-89/91 (Endeavor/Discovery)', ' Apollo 1', ' Gemini 10',
       ' Apollo 17', ' STS-105/108 (Discovery/Endeavor)', ' Apollo 7',
       ' Apollo 15', ' STS-48 (Discovery', ' Skylab 2', ' Apollo 13',
       ' ISS-01/STS-102 (Soyuz/Discovery)', ' Apollo-Soyuz Test Project',
       ' Apollo 16', ' STS-79/81 (Atlantis/Atlantis)',
       ' STS-113 (Endeavor/Soyuz)', ' STS-71 (Soyuz/Atlantis)'], dtype=object)
sns.countplot(y='SpaceShip', data=Mission_melt_df, order = Mission_melt_df['SpaceShip'].value_counts().nlargest(5).index)
<matplotlib.axes._subplots.AxesSubplot at 0x1ef748a7fd0>
Group과 Year가 연관있다? 아마 기수로 판단됨.
df['Group'] = df['Group'].astype(int)
df['Year'] = df['Year'].fillna(0).astype(int)
df[(df['Group']!=0 & df['Year'])][['Group','Year']].corr()
| Group | Year | |
|---|---|---|
| Group | 1.000000 | 0.980934 |
| Year | 0.980934 | 1.000000 |
심심풀이
어떤 성씨가 많이 갔을까?
df['Name'].apply(lambda x:x.split(' ')[0]).value_counts()
Michael        16
James          15
John           13
Robert         12
William        12
Charles        11
Richard        10
Donald          7
Gregory         6
David           6
Ronald          6
Thomas          6
Kenneth         5
Scott           5
Steven          5
Daniel          5
Mark            5
Stephen         5
Edward          4
Paul            4
Joseph          4
Kevin           3
Kathryn         3
Alan            3
Frederick       3
Andrew          3
Jeffrey         3
Christopher     3
Douglas         2
Jerry           2
               ..
Rex             1
Judith          1
J.              1
Dale            1
Barbara         1
Edgar           1
Stuart          1
Tracy           1
Anthony         1
Taylor          1
Pierre          1
Patrick         1
Clifton         1
Millie          1
Sandra          1
Gerald          1
Bernard         1
Piers           1
Brent           1
Marsha          1
Eric            1
Eugene          1
Theodore        1
Lodewijk        1
Serena          1
Philip          1
Virgil          1
Russell         1
Norman          1
Bryan           1
Name: Name, dtype: int64
