IMDB Movie's ratings Dataset
Background
How can we tell the greatness of a movie before it is released in cinema?
This question puzzled me for a long time since there is no universal way to claim the goodness of movies. Many people rely on critics to gauge the quality of a film, while others use their instincts. But it takes the time to obtain a reasonable amount of critics review after a movie is released. And human instinct sometimes is unreliable.
Question
- Given that thousands of movies were produced each year, is there a better way for us to tell the greatness of movie without relying on critics or our own instincts?
- Will the number of human faces in movie poster correlate with the movie rating?
Method
To answer this question, I scraped 5000+ movies from IMDB website using a Python library called “scrapy”.
The scraping process took 2 hours to finish. In the end, I was able to obtain all needed 28 variables for 5043 movies and 4906 posters (998MB), spanning across 100 years in 66 countries. There are 2399 unique director names, and thousands of actors/actresses. Below are the 28 variables:
- “movie_title”
- “color”
- “num_critic_for_reviews”
- “movie_facebook_likes”
- “duration”
- “director_name”
- “director_facebook_likes”
- “actor_3_name”
- “actor_3_facebook_likes”
- “actor_2_name”
- “actor_2_facebook_likes”
- “actor_1_name”
- “actor_1_facebook_likes”
- “gross”
- “genres”
- “num_voted_users”
- “cast_total_facebook_likes”
- “facenumber_in_poster”
- “plot_keywords”
- “movie_imdb_link”
- “num_user_for_reviews”
- “language”
- “country”
- “content_rating”
- “budget”
- “title_year”
- “imdb_score”
- “aspect_ratio” To answer question 2, I applied the human face detection algorithm on all the posters using python library called dlib, and extracted the number of faces in posters.
탐색적 분석
import pandas as pd
import numpy as np
import matplotlib.pyplot as plt
import seaborn as sns
import datetime as dt
%matplotlib inline
- How people can know rating(like greatness of moives) before watching a moive
- without critics or our own instincts? It’s the point of this Analysis
movies = pd.read_csv("data/movie_metadata.csv")
print(movies.head())
   color      director_name  num_critic_for_reviews  duration  \
0  Color      James Cameron                   723.0     178.0
1  Color     Gore Verbinski                   302.0     169.0
2  Color         Sam Mendes                   602.0     148.0
3  Color  Christopher Nolan                   813.0     164.0
4    NaN        Doug Walker                     NaN       NaN

   director_facebook_likes  actor_3_facebook_likes      actor_2_name  \
0                      0.0                   855.0  Joel David Moore
1                    563.0                  1000.0     Orlando Bloom
2                      0.0                   161.0      Rory Kinnear
3                  22000.0                 23000.0    Christian Bale
4                    131.0                     NaN        Rob Walker

   actor_1_facebook_likes        gross                           genres  \
0                  1000.0  760505847.0  Action|Adventure|Fantasy|Sci-Fi
1                 40000.0  309404152.0         Action|Adventure|Fantasy
2                 11000.0  200074175.0        Action|Adventure|Thriller
3                 27000.0  448130642.0                  Action|Thriller
4                   131.0          NaN                      Documentary

          ...          num_user_for_reviews language  country  content_rating  \
0         ...                        3054.0  English      USA           PG-13
1         ...                        1238.0  English      USA           PG-13
2         ...                         994.0  English       UK           PG-13
3         ...                        2701.0  English      USA           PG-13
4         ...                           NaN      NaN      NaN             NaN

        budget  title_year actor_2_facebook_likes imdb_score  aspect_ratio  \
0  237000000.0      2009.0                  936.0        7.9          1.78
1  300000000.0      2007.0                 5000.0        7.1          2.35
2  245000000.0      2015.0                  393.0        6.8          2.35
3  250000000.0      2012.0                23000.0        8.5          2.35
4          NaN         NaN                   12.0        7.1           NaN

  movie_facebook_likes
0                33000
1                    0
2                85000
3               164000
4                    0

[5 rows x 28 columns]
print(movies.columns)
Index(['color', 'director_name', 'num_critic_for_reviews', 'duration',
       'director_facebook_likes', 'actor_3_facebook_likes', 'actor_2_name',
       'actor_1_facebook_likes', 'gross', 'genres', 'actor_1_name',
       'movie_title', 'num_voted_users', 'cast_total_facebook_likes',
       'actor_3_name', 'facenumber_in_poster', 'plot_keywords',
       'movie_imdb_link', 'num_user_for_reviews', 'language', 'country',
       'content_rating', 'budget', 'title_year', 'actor_2_facebook_likes',
       'imdb_score', 'aspect_ratio', 'movie_facebook_likes'],
      dtype='object')
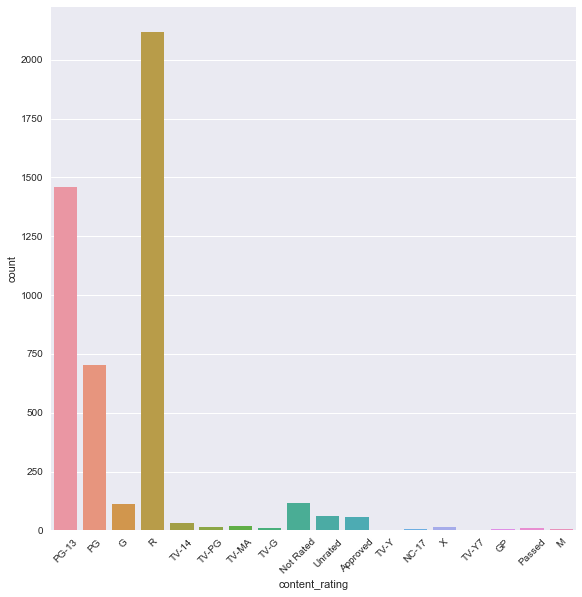
print(movies['content_rating'].value_counts()) # content rating -> 상영등급.
R            2118
PG-13        1461
PG            701
Not Rated     116
G             112
Unrated        62
Approved       55
TV-14          30
TV-MA          20
TV-PG          13
X              13
TV-G           10
Passed          9
NC-17           7
GP              6
M               5
TV-Y7           1
TV-Y            1
Name: content_rating, dtype: int64
상영등급별 분포
sns.factorplot('content_rating',kind='count',data=movies, size=8)
plt.xticks(rotation=45)
(array([ 0,  1,  2,  3,  4,  5,  6,  7,  8,  9, 10, 11, 12, 13, 14, 15, 16,
        17]), <a list of 18 Text xticklabel objects>)
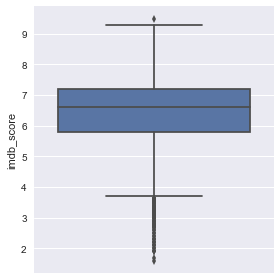
최대,최소 평점
movies['imdb_score'].max() # 10 is highest, maximun of rating is 9.5 in this db
9.5
movies['imdb_score'].min() # 0 is lowest, minimun of rating is 1.6 in this db
1.6000000000000001
sns.factorplot(y='imdb_score',kind='box',data=movies)
<seaborn.axisgrid.FacetGrid at 0xc83f5f0>
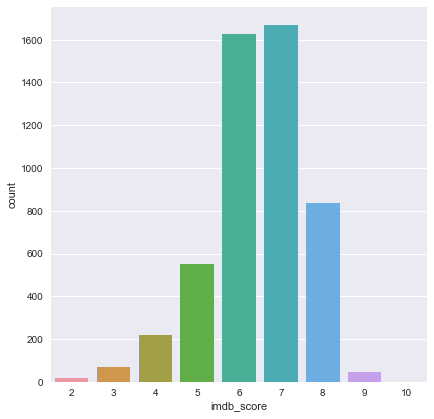
우선 영향도를 보기 위해서 평점을 반올림을 통해서 구분이 잘되도록 변환
df = movies.copy()
df['imdb_score'] = df['imdb_score'].apply(lambda x:int(round(x)))
df['imdb_score'].value_counts()
7     1670
6     1627
8      838
5      550
4      219
3       70
9       48
2       20
10       1
Name: imdb_score, dtype: int64
sns.factorplot('imdb_score',kind='count',data=df, size=6)
<seaborn.axisgrid.FacetGrid at 0xc94ce30>
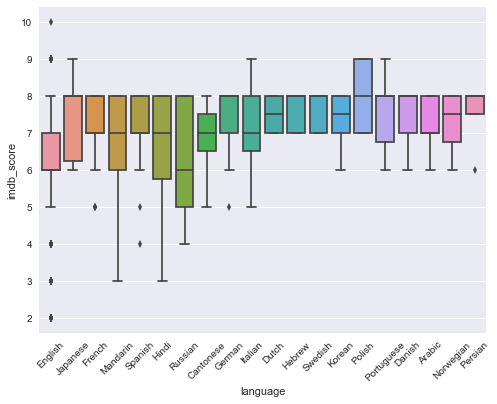
IMDB Score VS Country
tmp = df['language'].value_counts()
language_list = tmp[tmp>3].index.tolist()
sns.boxplot(y='imdb_score',x='language',data=df[df['language'].isin(language_list)])
plt.xticks(rotation=45)
(array([ 0,  1,  2,  3,  4,  5,  6,  7,  8,  9, 10, 11, 12, 13, 14, 15, 16,
        17, 18, 19]), <a list of 20 Text xticklabel objects>)
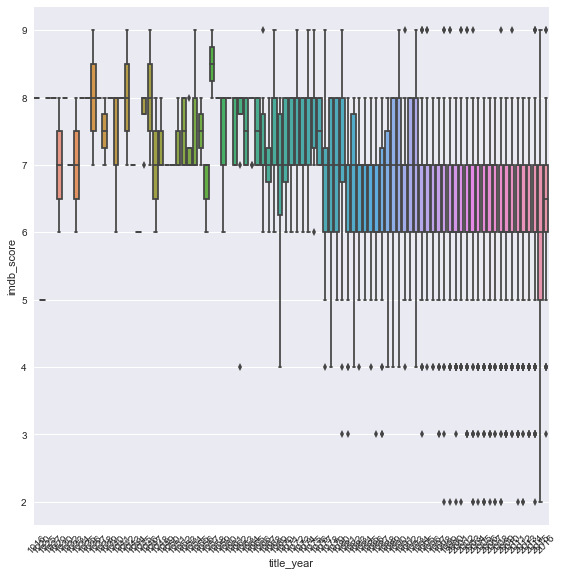
IMDB Score vs Movie Year
- 년도가 높아 질수록 영화의 평점 수는 갭도 커지면서, 아마 엔터 위주의 영화만 출시 되는 경향이 있는 듯하다.
- 년도가 높을 수록 Score는 낮다.
title_year_df = df[['title_year','imdb_score']]

title_year_df = title_year_df.dropna()
title_year_df['title_year'] = title_year_df['title_year'].astype(int)
sns.factorplot(y='imdb_score',x='title_year',data=title_year_df,kind='box', size=8)
plt.xticks(rotation=45)
(array([ 0,  1,  2,  3,  4,  5,  6,  7,  8,  9, 10, 11, 12, 13, 14, 15, 16,
        17, 18, 19, 20, 21, 22, 23, 24, 25, 26, 27, 28, 29, 30, 31, 32, 33,
        34, 35, 36, 37, 38, 39, 40, 41, 42, 43, 44, 45, 46, 47, 48, 49, 50,
        51, 52, 53, 54, 55, 56, 57, 58, 59, 60, 61, 62, 63, 64, 65, 66, 67,
        68, 69, 70, 71, 72, 73, 74, 75, 76, 77, 78, 79, 80, 81, 82, 83, 84,
        85, 86, 87, 88, 89, 90]), <a list of 91 Text xticklabel objects>)
IMDB Score vs Facebook Popularity
- Number of facebook likes effect high rating of imdb_score
- Correlation : 0.24
sns.boxplot(x='imdb_score',y='movie_facebook_likes',data=df)
<matplotlib.axes._subplots.AxesSubplot at 0xe9abb70>
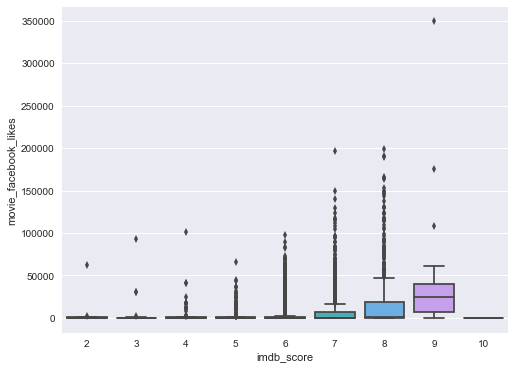
print(df[['movie_facebook_likes','imdb_score']].corr())
                      movie_facebook_likes  imdb_score
movie_facebook_likes              1.000000    0.239623
imdb_score                        0.239623    1.000000
Correlation analysis With Continuous Varibles
columns = df.columns
discrete = []
continuous = []
for i in columns:
    if df[i].dtype =='object':
        discrete.append(i)
    else:
        continuous.append(i)
columns
Index(['color', 'director_name', 'num_critic_for_reviews', 'duration',
       'director_facebook_likes', 'actor_3_facebook_likes', 'actor_2_name',
       'actor_1_facebook_likes', 'gross', 'genres', 'actor_1_name',
       'movie_title', 'num_voted_users', 'cast_total_facebook_likes',
       'actor_3_name', 'facenumber_in_poster', 'plot_keywords',
       'movie_imdb_link', 'num_user_for_reviews', 'language', 'country',
       'content_rating', 'budget', 'title_year', 'actor_2_facebook_likes',
       'imdb_score', 'aspect_ratio', 'movie_facebook_likes'],
      dtype='object')
sns.pairplot(df[continuous].dropna(),kind="reg")
<seaborn.axisgrid.PairGrid at 0xe30a730>

df_corr = df[continuous].dropna().corr()
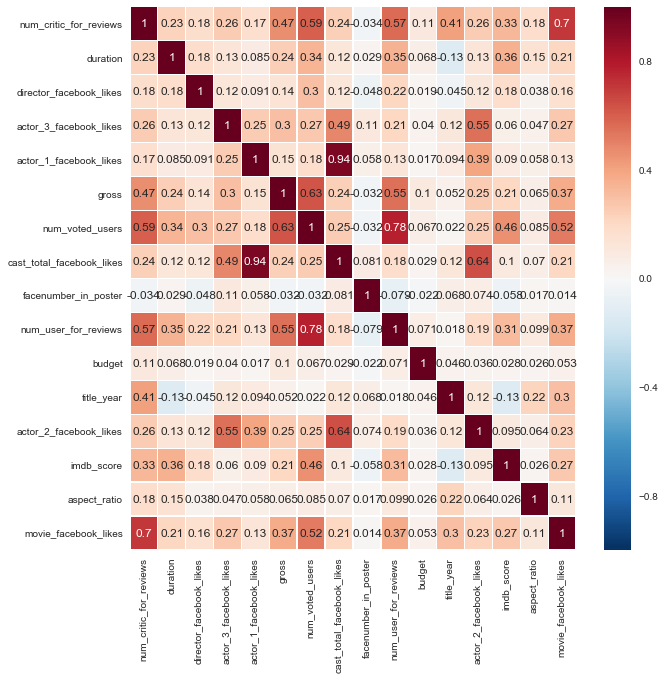
연속변수 상의 Correlation
- Number of Critic for reviews
- Duration
- Gross
- Number of voted Users
- Number of User Reviews
- Number of Facebook Likes 가 긍정적인 영향을 미쳤다.
fig, ax = plt.subplots(figsize=(10,10))
sns.heatmap(df_corr,
            xticklabels=df_corr.columns.values,
            yticklabels=df_corr.columns.values,
           annot=True, linewidths=.5, ax=ax)
<matplotlib.axes._subplots.AxesSubplot at 0x19acbad0>
Q2 : Will the number of human faces in movie poster correlate with the movie rating?
A2 : Nob, There’s nothing about realtion with two data number of face in poster and imdbsocre, it’s Almost 0 Correation with two factors
print(df['facenumber_in_poster'].head())
0    0.0
1    0.0
2    1.0
3    0.0
4    0.0
Name: facenumber_in_poster, dtype: float64
df2 = df.dropna().copy()
df2['facenumber_in_poster'] = df2['facenumber_in_poster'].astype(int)
sns.factorplot('facenumber_in_poster',kind='count',data=df2, size=6)
<seaborn.axisgrid.FacetGrid at 0x1a213c10>
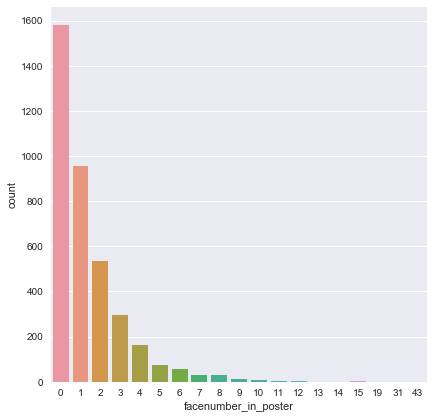
realtionOfFN = df[['facenumber_in_poster','imdb_score']].dropna().corr()
print(realtionOfFN)
                      facenumber_in_poster  imdb_score
facenumber_in_poster              1.000000   -0.056229
imdb_score                       -0.056229    1.000000
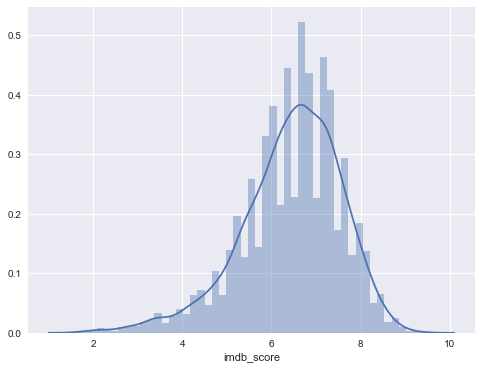
Histogram of IMDB scores(0~10)
sns.set(rc={"figure.figsize": (8, 6)});
sns.distplot(movies['imdb_score'])
C:\ProgramData\Anaconda3\envs\work\lib\site-packages\statsmodels\nonparametric\kdetools.py:20: VisibleDeprecationWarning: using a non-integer number instead of an integer will result in an error in the future
  y = X[:m/2+1] + np.r_[0,X[m/2+1:],0]*1j


<matplotlib.axes._subplots.AxesSubplot at 0x1c3ad970>
Delete columns don’t need
del df['movie_imdb_link']
del df['color']
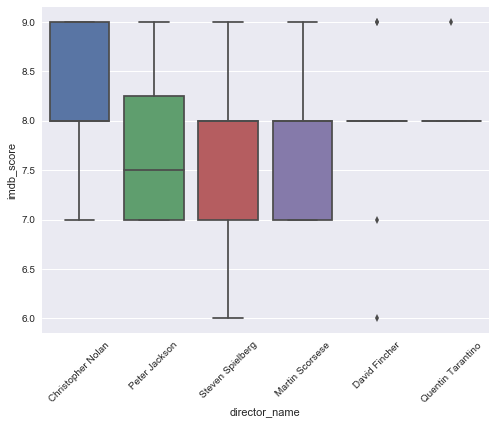
Relation with director_name and imdb_score
- A : A little relation with each other but… not a lot
number of directors
- 2399
len(df['director_name'].unique())
2399
tmp_X = pd.get_dummies(df['director_name'])
tmp_X['imdb_score'] = df['imdb_score']
df_corr = tmp_X.corr()
df_corr['imdb_score'][:5]
A. Raven Cruz     -0.053557
Aaron Hann        -0.005301
Aaron Schneider    0.006763
Aaron Seltzer     -0.041493
Abel Ferrara       0.006763
Name: imdb_score, dtype: float64
corr = df_corr['imdb_score']
corr[corr>0.05]
Christopher Nolan    0.061824
David Fincher        0.055771
Martin Scorsese      0.065437
Peter Jackson        0.054830
Quentin Tarantino    0.057556
Steven Spielberg     0.063032
imdb_score           1.000000
Name: imdb_score, dtype: float64
director_name_list = corr[corr>0.05].index.tolist()
print(director_name_list)
['Christopher Nolan', 'David Fincher', 'Martin Scorsese', 'Peter Jackson', 'Quentin Tarantino', 'Steven Spielberg', 'imdb_score']
df[df['director_name']=='Steven Spielberg'][['imdb_score','movie_title']]
| imdb_score | movie_title | |
|---|---|---|
| 54 | 6 | Indiana Jones and the Kingdom of the Crystal S... |
| 178 | 7 | The BFG |
| 189 | 6 | War of the Worlds |
| 194 | 7 | The Adventures of Tintin |
| 284 | 8 | Minority Report |
| 373 | 7 | A.I. Artificial Intelligence |
| 523 | 6 | The Lost World: Jurassic Park |
| 536 | 7 | The Terminal |
| 545 | 8 | Munich |
| 589 | 7 | Hook |
| 604 | 7 | War Horse |
| 648 | 9 | Saving Private Ryan |
| 653 | 7 | Lincoln |
| 697 | 8 | Jurassic Park |
| 911 | 8 | Catch Me If You Can |
| 1039 | 8 | Indiana Jones and the Last Crusade |
| 1224 | 8 | Bridge of Spies |
| 1248 | 7 | Amistad |
| 1556 | 6 | 1941 |
| 1749 | 8 | Indiana Jones and the Temple of Doom |
| 1874 | 9 | Schindler's List |
| 2152 | 8 | Raiders of the Lost Ark |
| 2154 | 8 | Close Encounters of the Third Kind |
| 2611 | 8 | The Color Purple |
| 2917 | 8 | Jaws |
| 3080 | 8 | E.T. the Extra-Terrestrial |
df['director_name'] = df['director_name'].astype(object)
sns.boxplot(y='imdb_score',x='director_name',data=df[df['director_name'].isin(director_name_list)])
plt.xticks(rotation=45)
(array([0, 1, 2, 3, 4, 5]), <a list of 6 Text xticklabel objects>)
3. Relation with Genres
- Bad Effect : horror & comedy have a bad effection to rating of moives
- Good Effect : Biography, Documentary, Drama, History, War have good factors for rating of movies
genre_list = df['genres'].str.split('|')
print(genre_list[:5])
0    [Action, Adventure, Fantasy, Sci-Fi]
1            [Action, Adventure, Fantasy]
2           [Action, Adventure, Thriller]
3                      [Action, Thriller]
4                           [Documentary]
Name: genres, dtype: object
# set 으로 활용하면 되려나 (사용은 안함.)
genre = set()
for i in range(len(genre_list)):
    genre |= set(genre_list[i])
genre
{'Action',
 'Adventure',
 'Animation',
 'Biography',
 'Comedy',
 'Crime',
 'Documentary',
 'Drama',
 'Family',
 'Fantasy',
 'Film-Noir',
 'Game-Show',
 'History',
 'Horror',
 'Music',
 'Musical',
 'Mystery',
 'News',
 'Reality-TV',
 'Romance',
 'Sci-Fi',
 'Short',
 'Sport',
 'Thriller',
 'War',
 'Western'}
worst Way to make difference length list to DataFrame
genre_df = pd.DataFrame()
for i in range(len(genre_list)):
    genre_df = genre_df.append(pd.DataFrame(genre_list[i]).T)
print(genre_df.head())
             0          1         2       3    4    5    6    7
0       Action  Adventure   Fantasy  Sci-Fi  NaN  NaN  NaN  NaN
0       Action  Adventure   Fantasy     NaN  NaN  NaN  NaN  NaN
0       Action  Adventure  Thriller     NaN  NaN  NaN  NaN  NaN
0       Action   Thriller       NaN     NaN  NaN  NaN  NaN  NaN
0  Documentary        NaN       NaN     NaN  NaN  NaN  NaN  NaN
- Way 1.
genre_df = pd.DataFrame(genre_list.values.tolist(), index=genre_list.index)
print(genre_df.head())
             0          1         2       3     4     5     6     7
0       Action  Adventure   Fantasy  Sci-Fi  None  None  None  None
1       Action  Adventure   Fantasy    None  None  None  None  None
2       Action  Adventure  Thriller    None  None  None  None  None
3       Action   Thriller      None    None  None  None  None  None
4  Documentary       None      None    None  None  None  None  None
genre_df = pd.DataFrame(genre_list.values.tolist(), index=genre_list.index).replace({None:np.nan})
print(genre_df.head())
             0          1         2       3    4    5    6    7
0       Action  Adventure   Fantasy  Sci-Fi  NaN  NaN  NaN  NaN
1       Action  Adventure   Fantasy     NaN  NaN  NaN  NaN  NaN
2       Action  Adventure  Thriller     NaN  NaN  NaN  NaN  NaN
3       Action   Thriller       NaN     NaN  NaN  NaN  NaN  NaN
4  Documentary        NaN       NaN     NaN  NaN  NaN  NaN  NaN
- Way 2
genre_df = genre_list.apply(pd.Series)
print(genre_df.head())
             0          1         2       3    4    5    6    7
0       Action  Adventure   Fantasy  Sci-Fi  NaN  NaN  NaN  NaN
1       Action  Adventure   Fantasy     NaN  NaN  NaN  NaN  NaN
2       Action  Adventure  Thriller     NaN  NaN  NaN  NaN  NaN
3       Action   Thriller       NaN     NaN  NaN  NaN  NaN  NaN
4  Documentary        NaN       NaN     NaN  NaN  NaN  NaN  NaN
Making dummy data
- Count Varibles like dummy coding
- way 1
pd.get_dummies(genre_df.stack()).groupby(level=0).max().head()
- Way 2
print(genre_df.stack().groupby(level=0).value_counts().unstack(fill_value=0).head()) # int
   Action  Adventure  Animation  Biography  Comedy  Crime  Documentary  Drama  \
0       1          1          0          0       0      0            0      0
1       1          1          0          0       0      0            0      0
2       1          1          0          0       0      0            0      0
3       1          0          0          0       0      0            0      0
4       0          0          0          0       0      0            1      0

   Family  Fantasy   ...     Mystery  News  Reality-TV  Romance  Sci-Fi  \
0       0        1   ...           0     0           0        0       1
1       0        1   ...           0     0           0        0       0
2       0        0   ...           0     0           0        0       0
3       0        0   ...           0     0           0        0       0
4       0        0   ...           0     0           0        0       0

   Short  Sport  Thriller  War  Western
0      0      0         0    0        0
1      0      0         0    0        0
2      0      0         1    0        0
3      0      0         1    0        0
4      0      0         0    0        0

[5 rows x 26 columns]
print(genre_df.stack().groupby(level=0).value_counts().unstack().fillna(0).head()) # float
   Action  Adventure  Animation  Biography  Comedy  Crime  Documentary  Drama  \
0     1.0        1.0        0.0        0.0     0.0    0.0          0.0    0.0
1     1.0        1.0        0.0        0.0     0.0    0.0          0.0    0.0
2     1.0        1.0        0.0        0.0     0.0    0.0          0.0    0.0
3     1.0        0.0        0.0        0.0     0.0    0.0          0.0    0.0
4     0.0        0.0        0.0        0.0     0.0    0.0          1.0    0.0

   Family  Fantasy   ...     Mystery  News  Reality-TV  Romance  Sci-Fi  \
0     0.0      1.0   ...         0.0   0.0         0.0      0.0     1.0
1     0.0      1.0   ...         0.0   0.0         0.0      0.0     0.0
2     0.0      0.0   ...         0.0   0.0         0.0      0.0     0.0
3     0.0      0.0   ...         0.0   0.0         0.0      0.0     0.0
4     0.0      0.0   ...         0.0   0.0         0.0      0.0     0.0

   Short  Sport  Thriller  War  Western
0    0.0    0.0       0.0  0.0      0.0
1    0.0    0.0       0.0  0.0      0.0
2    0.0    0.0       1.0  0.0      0.0
3    0.0    0.0       1.0  0.0      0.0
4    0.0    0.0       0.0  0.0      0.0

[5 rows x 26 columns]
- Way 3
print(genre_df.apply(pd.value_counts, 1).fillna(0).astype(int).head())
   Action  Adventure  Animation  Biography  Comedy  Crime  Documentary  Drama  \
0       1          1          0          0       0      0            0      0
1       1          1          0          0       0      0            0      0
2       1          1          0          0       0      0            0      0
3       1          0          0          0       0      0            0      0
4       0          0          0          0       0      0            1      0

   Family  Fantasy   ...     Mystery  News  Reality-TV  Romance  Sci-Fi  \
0       0        1   ...           0     0           0        0       1
1       0        1   ...           0     0           0        0       0
2       0        0   ...           0     0           0        0       0
3       0        0   ...           0     0           0        0       0
4       0        0   ...           0     0           0        0       0

   Short  Sport  Thriller  War  Western
0      0      0         0    0        0
1      0      0         0    0        0
2      0      0         1    0        0
3      0      0         1    0        0
4      0      0         0    0        0

[5 rows x 26 columns]
df_genre = genre_df.stack().groupby(level=0).value_counts().unstack(fill_value=0)
df_genre['imdb_score'] = df['imdb_score']
print(df_genre.head())
   Action  Adventure  Animation  Biography  Comedy  Crime  Documentary  Drama  \
0       1          1          0          0       0      0            0      0
1       1          1          0          0       0      0            0      0
2       1          1          0          0       0      0            0      0
3       1          0          0          0       0      0            0      0
4       0          0          0          0       0      0            1      0

   Family  Fantasy     ...      News  Reality-TV  Romance  Sci-Fi  Short  \
0       0        1     ...         0           0        0       1      0
1       0        1     ...         0           0        0       0      0
2       0        0     ...         0           0        0       0      0
3       0        0     ...         0           0        0       0      0
4       0        0     ...         0           0        0       0      0

   Sport  Thriller  War  Western  imdb_score
0      0         0    0        0           8
1      0         0    0        0           7
2      0         1    0        0           7
3      0         1    0        0           8
4      0         0    0        0           7

[5 rows x 27 columns]
genre_corr = df_genre.corr()
genre_corr = genre_corr['imdb_score']
print(genre_corr[abs(genre_corr)>0.1])
Biography      0.154847
Comedy        -0.169327
Documentary    0.103043
Drama          0.287240
History        0.119900
Horror        -0.180024
War            0.110134
imdb_score     1.000000
Name: imdb_score, dtype: float64
Conclusion
- Number of Critic for reviews
- Duration
- Gross
- Number of voted Users
- Number of User Reviews
- Number of Facebook Likes
- Movie’s Genres : Biography, Drama, Historical things