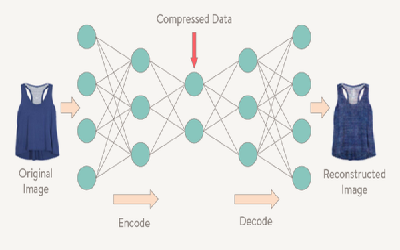
Auto Encoding
This is Concept of Auto Encoding with Neural Network.
3. AutoEncoder
- 차원축소
3.1 문제 인식
- 대부분의 데이터는 소수의 변수로 표현할 수 있다
- 성격 형용사: 수 천개 = 성격요인: 5개 + 1~2개
- 차원 축소: 데이터를 소수의 변수로 표현하는 것
- 예: 요인분석(FA), 주성분분석(PCA)
3.2 차원 축소 용도
- 시각화
- 많은 변수를 가진 데이터 -> 2차원으로 축소 -> 시각화
-
시각화에서 변수가 많다. -> 차원이 많다 -> 보기 힘들고 그리기 힘들다. -> 2차원으로 줄인다.
- 노이즈 제거
- 차원이 축소되면 주요한 특징만 남음 -> 노이즈 제거
- 차원이 높으면 노이즈가 많을 확률이 높다. => 차원을 줄일 때 가능한 내용을 많이 포함할 수 있도록 줄인다. (PCA)
- 유사성
-
작은 차원에서 비교가 더 쉽고 정확할 수 있음
- 데이터 생성
- 차원 축소 -> 약간의 변화 -> 원래 차원으로 복구
- Input Shape : 784
- Output Shape : 784 동일하게
- 중간으로 갈 수록 줄어든다.

이미지 복원

from keras.datasets import mnist
Using TensorFlow backend.
(x_train, y_train), (x_test,y_test) = mnist.load_data()
_, width, height = x_train.shape
width
28
데이터 보기
%matplotlib inline
import matplotlib.pyplot as plt
plt.imshow(x_train[6,],cmap='gray')
<matplotlib.image.AxesImage at 0x1f2684702b0>

y_train[6]
1
데이터 전처리
x_train.astype('float32')
input_train = x_train / 255.0
x_test.astype('float32')
input_test = x_test  / 255.0
from keras.models import Sequential
from keras.layers import Dense, Flatten, Reshape
from keras.optimizers import Adam
model = Sequential()
model.add(Flatten(input_shape=(width,height,))) # 784로 만들어주는 효과
model.add(Dense(196,activation='relu'))
model.add(Dense(49,activation='relu'))
model.add(Dense(196,activation='relu'))
model.add(Dense(width*height, activation='sigmoid'))
# softmax가 아니라 sigmoid가 나온 이유는 결과를 그대로 출력해야 되니깐.
# 원복하는 느낌으로 하는것이다.
model.add(Reshape((width,height)))
model.summary()
_________________________________________________________________
Layer (type)                 Output Shape              Param #
=================================================================
flatten_1 (Flatten)          (None, 784)               0
_________________________________________________________________
dense_1 (Dense)              (None, 196)               153860
_________________________________________________________________
dense_2 (Dense)              (None, 49)                9653
_________________________________________________________________
dense_3 (Dense)              (None, 196)               9800
_________________________________________________________________
dense_4 (Dense)              (None, 784)               154448
_________________________________________________________________
reshape_1 (Reshape)          (None, 28, 28)            0
=================================================================
Total params: 327,761
Trainable params: 327,761
Non-trainable params: 0
_________________________________________________________________
- mse로하면 0.2 - 0.1 = 0.1 ^2 으로 해야되므로 그나마 색이 가장 비슷하도록 만들어주려고 mse를 사용
- 뭘 사용해도 크게 변하는게 없다고는 한다.
model.compile(loss='mse',
              optimizer=Adam(),
              metrics=['mse'])
batch_size = 128
epochs = 7
- input_train이 들어가서 input_train이 나와야 된다.
history = model.fit(input_train, input_train,
                    batch_size=batch_size,
                    epochs=epochs,
                    verbose=1,
                    validation_data=(input_test, input_test))
Train on 60000 samples, validate on 10000 samples
Epoch 1/7
60000/60000 [==============================] - 4s - loss: 0.0380 - mean_squared_error: 0.0380 - val_loss: 0.0171 - val_mean_squared_error: 0.0171
Epoch 2/7
60000/60000 [==============================] - 3s - loss: 0.0142 - mean_squared_error: 0.0142 - val_loss: 0.0114 - val_mean_squared_error: 0.0114
Epoch 3/7
60000/60000 [==============================] - 2s - loss: 0.0106 - mean_squared_error: 0.0106 - val_loss: 0.0094 - val_mean_squared_error: 0.0094
Epoch 4/7
60000/60000 [==============================] - 2s - loss: 0.0091 - mean_squared_error: 0.0091 - val_loss: 0.0084 - val_mean_squared_error: 0.0084
Epoch 5/7
60000/60000 [==============================] - 3s - loss: 0.0083 - mean_squared_error: 0.0083 - val_loss: 0.0077 - val_mean_squared_error: 0.0077
Epoch 6/7
60000/60000 [==============================] - 3s - loss: 0.0078 - mean_squared_error: 0.0078 - val_loss: 0.0073 - val_mean_squared_error: 0.0073
Epoch 7/7
60000/60000 [==============================] - 2s - loss: 0.0074 - mean_squared_error: 0.0074 - val_loss: 0.0070 - val_mean_squared_error: 0.0070
input_regen = model.predict(input_test)
plt.imshow(input_test[0,], cmap='gray')
<matplotlib.image.AxesImage at 0x1f2595fc518>

plt.imshow(input_regen[0,], cmap='gray')
<matplotlib.image.AxesImage at 0x1f2040f3cc0>

노이즈 제거
import numpy as np
np.random.normal(scale=0.2, size=(width, height))[:1]
# 평균이 0 이고 표준편차가 0.2인 정규 분포 생성.
array([[-0.39989141, -0.22319088,  0.04684294, -0.18300795,  0.08375335,
         0.07602899, -0.08442226,  0.54114196,  0.39790913,  0.04700243,
        -0.08484798, -0.0522912 , -0.20539976, -0.16775749,  0.11748794,
        -0.02572264,  0.28832584,  0.24820864,  0.07828157, -0.08051534,
        -0.203257  , -0.17657842,  0.04923957,  0.31316393, -0.01393563,
        -0.42566216, -0.03817569,  0.00568235]])
noise = input_test + np.random.normal(scale=0.2, size=(width, height))
noise[1,1]
array([ 0.17221764,  0.0165918 , -0.12682235,  0.20189582, -0.6112805 ,
       -0.06996042,  0.08622505,  0.23280964, -0.02682088,  0.13984273,
        0.03264182, -0.34890275, -0.28865885,  0.09243602,  0.18132087,
        0.06074435,  0.26922136,  0.27557581, -0.10735164, -0.29737936,
       -0.23307369,  0.03983526,  0.23424512, -0.44435803, -0.08747408,
       -0.24458775, -0.14776542, -0.26286131])
noise = np.clip(noise, 0, 1) # 0보다 작은 값이 나오면 0 1보다 큰값이 나오면 1
plt.imshow(noise[0,], cmap='gray')
<matplotlib.image.AxesImage at 0x1f2585be898>

denoise = model.predict(noise)
plt.imshow(denoise[0,], cmap='gray')
<matplotlib.image.AxesImage at 0x1f259bd5240>

모델 Save
model.save("model_save.sav")
모델 Load
from keras.models import load_model
model = load_model("model_save.sav")
output = model.predict(input_test)
plt.imshow(output[0,], cmap='gray')
<matplotlib.image.AxesImage at 0x1f29dbf6eb8>

