Summary of Management Statistics with R
경영 통계 데이터 요약 및 정리
- KMU BigData MBA 특강 정리.
library("IRdisplay")
display_png(file="/src/201607/chapter1/1.PNG", width = 600)
display_png(file="/src/201607/chapter1/2.PNG", width = 600)


install.packages("reshape",repos = "http://cran.us.r-project.org")
Installing package into 'C:/Users/byung/Documents/R/win-library/3.3'
(as 'lib' is unspecified)


package 'reshape' successfully unpacked and MD5 sums checked

The downloaded binary packages are in
	C:\Users\byung\AppData\Local\Temp\RtmpkJBkFH\downloaded_packages
library(reshape)
한 레스토랑의 웨이터가 몇 달간 받은 팁을 기록.
tips <- tips
str(tips)
'data.frame':	244 obs. of  7 variables:
 $ total_bill: num  17 10.3 21 23.7 24.6 ...
 $ tip       : num  1.01 1.66 3.5 3.31 3.61 4.71 2 3.12 1.96 3.23 ...
 $ sex       : Factor w/ 2 levels "Female","Male": 1 2 2 2 1 2 2 2 2 2 ...
 $ smoker    : Factor w/ 2 levels "No","Yes": 1 1 1 1 1 1 1 1 1 1 ...
 $ day       : Factor w/ 4 levels "Fri","Sat","Sun",..: 3 3 3 3 3 3 3 3 3 3 ...
 $ time      : Factor w/ 2 levels "Dinner","Lunch": 1 1 1 1 1 1 1 1 1 1 ...
 $ size      : int  2 3 3 2 4 4 2 4 2 2 ...
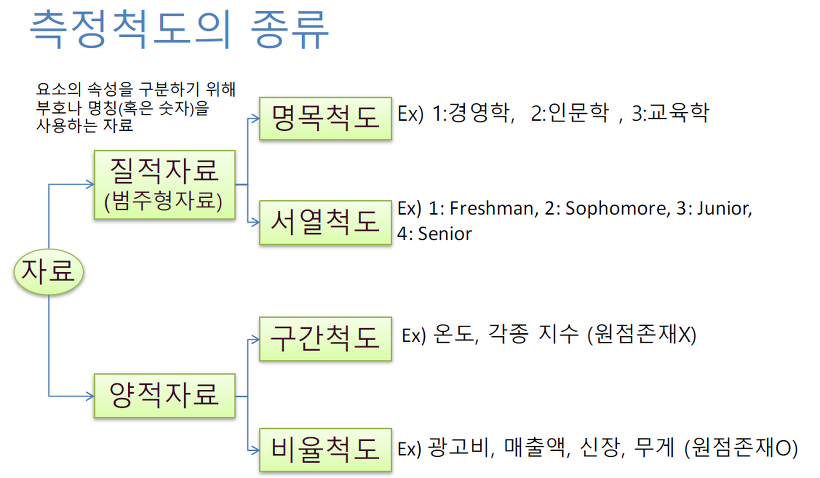
#평균과 중간값 이런것을 계산 해주는거는 양적변수, 아닐경우 질적변수
summary(tips)
   total_bill         tip             sex      smoker      day         time
 Min.   : 3.07   Min.   : 1.000   Female: 87   No :151   Fri :19   Dinner:176
 1st Qu.:13.35   1st Qu.: 2.000   Male  :157   Yes: 93   Sat :87   Lunch : 68
 Median :17.80   Median : 2.900                          Sun :76
 Mean   :19.79   Mean   : 2.998                          Thur:62
 3rd Qu.:24.13   3rd Qu.: 3.562
 Max.   :50.81   Max.   :10.000
      size
 Min.   :1.00
 1st Qu.:2.00
 Median :2.00
 Mean   :2.57
 3rd Qu.:3.00
 Max.   :6.00
head(tips)
| total_bill | tip | sex | smoker | day | time | size | |
|---|---|---|---|---|---|---|---|
| 1 | 16.99 | 1.01 | Female | No | Sun | Dinner | 2 |
| 2 | 10.34 | 1.66 | Male | No | Sun | Dinner | 3 |
| 3 | 21.01 | 3.5 | Male | No | Sun | Dinner | 3 |
| 4 | 23.68 | 3.31 | Male | No | Sun | Dinner | 2 |
| 5 | 24.59 | 3.61 | Female | No | Sun | Dinner | 4 |
| 6 | 25.29 | 4.71 | Male | No | Sun | Dinner | 4 |
- 범주형 sex, smoker, day, time
- 양적 : tip, total_bill
#size의 경우 1~6의 숫자로 구성 => 범주형으로 보고싶다? 여기서 size는 온 사람들의 수.
#factor를 사용.
tips$size <- factor(tips$size)
head(tips$size,3)
# $ size      : Factor w/ 6 levels "1","2","3","4",..: 2 3 3 2 4 4 2 4 2 2 ...
<ol class=list-inline> <li>2</li> <li>3</li> <li>3</li> </ol>
str(tips)
'data.frame':	244 obs. of  7 variables:
 $ total_bill: num  17 10.3 21 23.7 24.6 ...
 $ tip       : num  1.01 1.66 3.5 3.31 3.61 4.71 2 3.12 1.96 3.23 ...
 $ sex       : Factor w/ 2 levels "Female","Male": 1 2 2 2 1 2 2 2 2 2 ...
 $ smoker    : Factor w/ 2 levels "No","Yes": 1 1 1 1 1 1 1 1 1 1 ...
 $ day       : Factor w/ 4 levels "Fri","Sat","Sun",..: 3 3 3 3 3 3 3 3 3 3 ...
 $ time      : Factor w/ 2 levels "Dinner","Lunch": 1 1 1 1 1 1 1 1 1 1 ...
 $ size      : Factor w/ 6 levels "1","2","3","4",..: 2 3 3 2 4 4 2 4 2 2 ...
tips2 <- tips
tips2$size  <- factor(tips2$size)

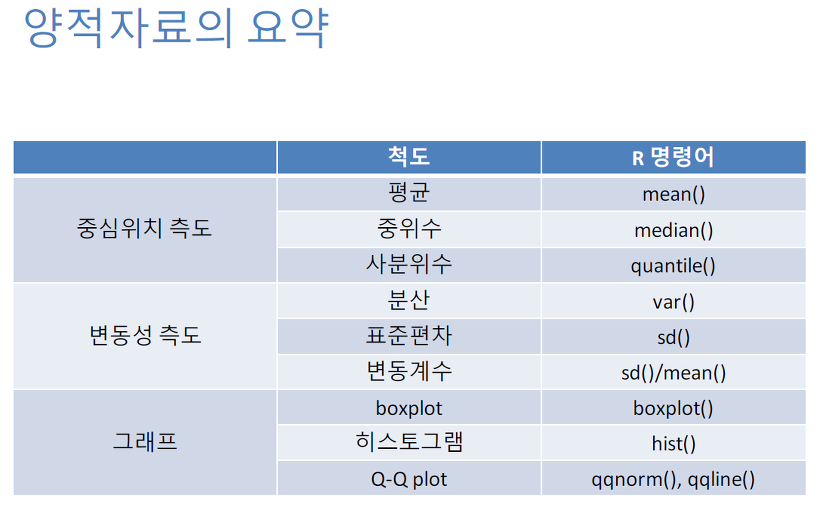
mean(tips2$tip)
median(tips2$tip)
tips2$tip[1] <- 100
median(tips2$tip) # 중위수는 Outlier가 있더라도 변화가 없다.
mean(tips2$tip)
2.99827868852459
2.9
2.96
3.40397540983607
quantile(tips2$tip)
<dl class=dl-horizontal> <dt>0%</dt> <dd>1</dd> <dt>25%</dt> <dd>2</dd> <dt>50%</dt> <dd>2.96</dd> <dt>75%</dt> <dd>3.6025</dd> <dt>100%</dt> <dd>100</dd> </dl>
- 변동성 측도. 얼마나 퍼져있느냐?
- 분산, 표준편차 ( PDF식 잘못됨 )
- x bar + - 2sd => 95%
mean(tips$tip)
var(tips$tip)
sd(tips$tip)
2.99827868852459
1.91445463806247
1.38363818900118
- 변동계수 : sd/x bar => 비율을 비교할 수 있는 것이다.
- 같은 sd라도 mean에 따라 크기의 비율이 다를 수 도있다.
- 즉, mean 10 sd 1 mean 100 sd 1 두개의 산포 정도는 다르다 라는 것.
#IQR -> boxplot 의 range Q3 - Q1
IQR(tips$tip) # [1] 1.5625
1.5625
options(repr.plot.width=4, repr.plot.height=4)
boxplot(tips$tip,horizontal = T)

barplot(tips$tip,xlim=c(0,10))
title(main="main of tips", xlab = "tips")

hist(tips$tip,20)

Q-Q plot 그래프를 이용한 정규성 확인
options(repr.plot.width=6, repr.plot.height=4)
qqnorm(tips$tip)
qqline(tips$tip)

display_png(file="/src/201607/chapter1/3.PNG", width = 600)

### bar chart, pie chart
- table => 도수분표표로 만들어준다.
# 원래는 가장 먼저 나오는 순서대로 factor생성(label)
tips$day <- factor(tips$day,levels = c("Thur","Fri","Sat","Sun")) #levels 지정하여 목~일 로 출력되도록 변경.
unique(tips$day)
mytable <- table(tips$day)
mytable
<ol class=list-inline> <li>Sun</li> <li>Sat</li> <li>Thur</li> <li>Fri</li> </ol>
Thur  Fri  Sat  Sun
  62   19   87   76
options(repr.plot.width=4, repr.plot.height=3)
barplot(table(tips$day))

pi-chart
lbl <- paste(names(mytable),",",round(prop.table(mytable),2)*100,"%",sep = "")  #labels 이름 부여를 위한 작업.
pie(mytable, labels=lbl) # 간단한 모양에 라벨 추가.

두개의 범주형 변수 자료의 요약
mytable2 <- xtabs(~sex+day,tips) #앞 종속, 뒤 설명. 카운트를 하려면 앞에 없이. 를~의 기준으로
mytable2
# ~ 앞에 없으면 카운트를 세서 준다. table형태로 출력.
        day
sex      Thur Fri Sat Sun
  Female   32   9  28  18
  Male     30  10  59  58
options(repr.plot.width=8, repr.plot.height=4)
par(mfcol=c(1,2))

barplot(mytable2,legend.text = c("Female","Male"))
barplot(mytable2,legend.text = c("Female","Male"),beside = T)

mosaicplot
- 더 많은 정보를 한눈에 볼 수 있다.
#더 많은 정보를 줄 수 있음.
par(mfcol=c(1,2))
mosaicplot(t(mytable2)) # 전치행렬.
mosaicplot(mytable2)

범주형 변수와 양적 변수의 요약
options(repr.plot.width=7, repr.plot.height=5)
boxplot(tip~day,data=tips, ylab="tips",xlab="day") #종속 tip 설명(독립) day

DF <- read.csv("SLData/movie_MBA2.csv",stringsAsFactors = F)
head(DF,3)
| title | release_date | week1_sales | week1_seen | nation | production | distributor | rating | genre | total_seen | total_sales | |
|---|---|---|---|---|---|---|---|---|---|---|---|
| 1 | 다크아워 | 2012-01-05 | 1165058500 | 142322 | 미국 | 이십세기폭스코리아(주) | 12세이상관람가 | 액션/어드벤쳐 | 162704 | 1321149000 | |
| 2 | 원더풀 라디오 | 2012-01-05 | 3992913500 | 541314 | 한국 | (주)영화사아이비젼,(주)기안컬처테인먼트 | 쇼박스㈜미디어플렉스 | 15세이상관람가 | 드라마 | 986287 | 7255598000 |
| 3 | 밀레니엄 : 여자를 증오한 남자들 | 2012-01-11 | 2196718000 | 281785 | 미국 | 한국소니픽쳐스릴리징브에나비스타영화㈜ | 청소년관람불가 | 스릴러/공포 | 443855 | 3504237000 |
str(DF)
'data.frame':	227 obs. of  11 variables:
 $ title       : chr  "다크아워" "원더풀 라디오" "밀레니엄 : 여자를 증오한 남자들" "장화신은 고양이" ...
 $ release_date: chr  "2012-01-05" "2012-01-05" "2012-01-11" "2012-01-12" ...
 $ week1_sales : num  1.17e+09 3.99e+09 2.20e+09 7.75e+09 7.37e+08 ...
 $ week1_seen  : int  142322 541314 281785 883384 104258 183724 916902 335960 209516 1239057 ...
 $ nation      : chr  "미국" "한국" "미국" "미국" ...
 $ production  : chr  "" "(주)영화사아이비젼,(주)기안컬처테인먼트" "" "" ...
 $ distributor : chr  "이십세기폭스코리아(주)" "쇼박스㈜미디어플렉스" "한국소니픽쳐스릴리징브에나비스타영화㈜" "씨제이이앤엠 주식회사" ...
 $ rating      : chr  "12세이상관람가" "15세이상관람가" "청소년관람불가" "전체관람가" ...
 $ genre       : chr  "액션/어드벤쳐" "드라마" "스릴러/공포" "애니메이션" ...
 $ total_seen  : int  162704 986287 443855 2080445 206344 276334 3459864 467697 283449 4058225 ...
 $ total_sales : num  1.32e+09 7.26e+09 3.50e+09 1.76e+10 1.44e+09 ...
options(repr.plot.width=4, repr.plot.height=5)
boxplot(DF$total_seen)

unique(DF$rating)
DF$rating[DF$rating == "12세이상관람가"] <- "12"
DF$rating[DF$rating == "15세이상관람가"] <- "15"
DF$rating[DF$rating == "청소년관람불가"] <- "under19"
DF$rating[DF$rating == "전체관람가"] <- "all"
unique(DF$rating)
<ol class=list-inline> <li>“12세이상관람가”</li> <li>“15세이상관람가”</li> <li>“청소년관람불가”</li> <li>“전체관람가”</li> </ol>
<ol class=list-inline> <li>“12”</li> <li>“15”</li> <li>“under19”</li> <li>“all”</li> </ol>
agratingSeen <- aggregate(total_seen~rating,data=DF,mean)
agratingSeen
| rating | total_seen | |
|---|---|---|
| 1 | 12 | 1774489.65116279 |
| 2 | 15 | 2095732.55319149 |
| 3 | all | 638541.291666667 |
| 4 | under19 | 1015156.57142857 |
barplot(agratingSeen[,2],names.arg = agratingSeen[,1], legend.text = "seen",main = "total_seen")

agratingSale <- aggregate(total_sales~rating,data = DF,mean)
agratingSale
| rating | total_sales | |
|---|---|---|
| 1 | 12 | 13595065509.3953 |
| 2 | 15 | 15129767237.4255 |
| 3 | all | 4716789616.52083 |
| 4 | under19 | 7651462719.42857 |
barplot(agratingSale[,2],names.arg = agratingSale[,1], legend.text = "sales",main = "sales & rating")

boxplot(total_seen~rating,data=DF, ylab="tips",xlab="rating")

range(DF$total_seen) # [1] 101351 12983330
<ol class=list-inline> <li>101351</li> <li>12983330</li> </ol>
tableOfRating <- table(DF$rating)
tableOfRating
     12      15     all under19
     43      94      48      42
options(repr.plot.width=7, repr.plot.height=3)
par(mfrow=c(1,2))
barplot(tableOfRating,ylab="CNT",xlab="Rating")
pie(tableOfRating)

options(repr.plot.width=5, repr.plot.height=4)
par(mfrow=c(1,1))
교수님 자료
summary(DF$total_seen)
    Min.  1st Qu.   Median     Mean  3rd Qu.     Max.
  101400   271300   790200  1527000  1719000 12980000
options(repr.plot.width=8, repr.plot.height=4)
par(mfrow=c(1,2))
boxplot(DF$total_seen,horizontal = T)
hist(DF$total_seen,20)

options(repr.plot.width=5, repr.plot.height=6)
par(las=2,mar=c(10,5,5,5))
boxplot(total_seen~rating,DF)

options(repr.plot.width=5, repr.plot.height=5)
library("plyr")
msales <- ddply(DF,~rating,summarize,mean_sales=mean(total_sales))
class(msales)
barplot(msales[,2],names.arg = msales[,1])
“data.frame”

tab <- xtabs(~genre+rating,DF)  # cross table
tab
               rating
genre           12 15 all under19
  가족           1  0   1       0
  기타           3  3   2       2
  드라마         8 20   2       6
  멜로/로맨스    4  5   0       5
  미스터리/범죄  1  9   0       6
  스릴러/공포    0 10   0       6
  애니메이션     2  0  39       0
  액션/어드벤쳐 19 33   3      14
  코미디         5 14   1       3
options(repr.plot.width=8, repr.plot.height=6)
par(mfrow=c(1,2))
#mosaicplot(tab)
#mosaicplot(t(tab))
display_png(file="/src/201607/chapter1/12.PNG")

